The Petri Dish: Percentage Activities from grade 6 to 8

This projects allows students to play with visualizing the growth of “critters” within a petri dish according to a set of rules that the group generates.

Part 1: Creating the critters, determining growth by pre-set rules, graphing, then computing proportional relationships using fractions and percentages.

Part 2: Setting a new rule for growth and continuing to practice t-charts, line graphs, and computing proportional relationships using fractions and percentages. Teachers: this can be completed multiple times, each time experimenting with a new rule.

Percentages Greater than 100 and Less than 1:

In grade 8, the way you can start to illustrate those tricky percents more than 100 and less than 1, is to highlight the importance of determining what is the whole group or 100%.

Percents greater than 100:

Percents less than 100:

Coming soon!

Options for Representing Data

So! You’ve spent a bunch of time collecting data and now have pages of tally marks and notes. We are now going to take it a step further and organize this data so that it can be read more clearly and easily. You have two options. Try both and compare!

Option 1: turn your data into some nice, clean bar or pictographs. How? Click here for some examples and advice. After you have completed your bar or pictograph, spend some time studying it. What does it tell you about the forest? Write down your ideas.

Option 2: Make a forest map with a legend. How? This is a fun one. We have made a video to guide you: Click here.

After you have tried both:

  • Time for your opinion! Which is your favourite? Make sure you explain why. Which one is the most useful for helping you see patterns of information that help you better understand the stories of the stumps you studied? Again, why?

Making a Bar Graph

How do you make a good graph? What is important to remember?

In the following Power Point, you will see three different graphs as they are being made! They are not all the same quality, however.

What do you notice about each graph? How does this impact your ability to read and understand them?

Graphing Power Point: Bar Graph powerpoint

Here are some extra resources to consider:

Videos for Graphing Beginners:

Click here for a Brain Pop video explaining how to make a bar graph.

Click here for a Brain Pop video explaining how to make a pictograph.

Videos for Experienced Graphers:

Click here for a Khan Academy video explaining how to make picture and bar graphs.


Helping Our Community: Make a Graph

Before you make a graph, you need to have something to count or measure. Here are some possible examples:

  • picking up litter
  • walking or biking to school
  • collecting food for the foodbank
  • earning money to help your community

It might take you a lot of time to collect data on the way you decided to help your community.

In order to create an interesting graph, you also need to create some categories that help people understand what you did a little bit more. For example:

  • If you picked up litter, you might want to count what types of litter you picked up
  • If you walked or biked to school, you might want to keep track of the weather to show how many days you walked when it was rainy, windy, cloudy, sunny or snowy
  • If you collected food for the foodbank, you might want to count the different types of food you collected
  • If you earned money, you might want to count the types of chores that you did

Say you decided to walk or bike to school. Your data collection page might look like this:

When you are done collecting data, you can turn it into a bar graph or a pictograph.

Videos for Graphing Beginners:

Click here for a Brain Pop video explaining how to make a bar graph.

Click here for a Brain Pop video explaining how to make a pictograph.

Videos for Experienced Graphers:

Click here for a Khan Academy video explaining how to make picture and bar graphs.


Road Trip Project

Contributed by Stephen Boles (gr. 4-5 teacher)

As a Social Studies guy I love cross curricular projects, especially when it comes to Math.  I designed this project based off of the classic SS Road Trip project I had to do when I was in High School. Students had to start at the school and travel around BC with a ‘limited’ ($10,000) budget.  They had to have a place to stay every night, do an activity in every city they were in (I gave then two days where the activity could be free), as well as 15 cent per km charged for gas and a $50 a day food cost.  There were also stipulations that they could only spend on night in a city and had a max time and distance traveled for the day.

I started the project with teaching the kids about, Distance, Time Elapsed and Financial Literacy.   On Fridays I would review the previous skills so they stayed fresh in their minds.

Then I introduced the project.  The project is made up of Multiple Parts. The first is introducing it to students and keeping their interest in it.   I decided to award prizes to students who completed certain tasks.  This was to prevent students form just saying they had completed it in one or two lessons; this is the same reason I had such a huge budget.  Then I just let the kids go.  They filled out their daily travel sheets, that kept record of their distance, time elapsed and budget.

I found that once the students began and learnt what tools or websites to use things began to flow smoothly.  I would have students ask if they could travel more than the allotted time or distance, “Nope, looks like you are going to have to find some place to stop over night,” that was met with an eye roll, a sigh and a chuckle.  The ones who wanted to challenge themselves really did, others who may struggle with math were engaged and challenged themselves in their own ways.  We did this for about 8-10 lessons.

Once students had completed the travel portion, I gave the kids a reflection sheet.  This was a great way to see what they enjoyed and what I could do better next time.

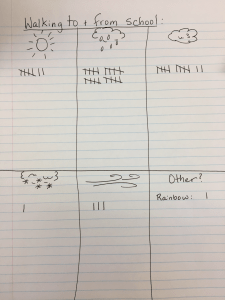
The final part of the project involves graphing.  I have just introduced this part to my class.  We will be graphing different aspects of the data they collected over their trip.  We brainstormed different things they could graph.  The students came up with some great ideas – especially for double bar graphs.

Looking back there are a few things I may adjust or add in the future.  It would be fun to add a daily or weekly journal and have some more cross curricular components.   Also the budget could be adjusted to add more of a challenge.  In the students reflections the comment that come up the most for what I could do better next time was “let us leave BC!”

Overall the kids and I had a lot of fun with this project! I hope you enjoy it as much as we did.

Skip to toolbar